Problem: NC Senators and Representatives have requested the exact number of NC jobs created in their district based on the results of a recent industrial extensions jobs survey.
Analysis Procedures: Database cardinality refers to the relationship between tables of data. These tables can be completely tabular information or attribute tables associated with spatial data. Connecting tabular data to spatial data allows new spatial relationships to be visualized and is important for solving GIS problems (Fig. 1). After adding the tabular data and reference files to ArcMap, the survey results table was first summarized by zip code. The zip code field in the survey results was used to join the jobs data to the reference zip code points. This new layer was spatially joined to both the Senate and House districts layers, which summed the number of jobs created within each district polygon. By adjusting symbology and labels, professional map layouts were created to communicate the exact number of new jobs created per district for the senators and representatives. A procedure log for this exercise is available here.
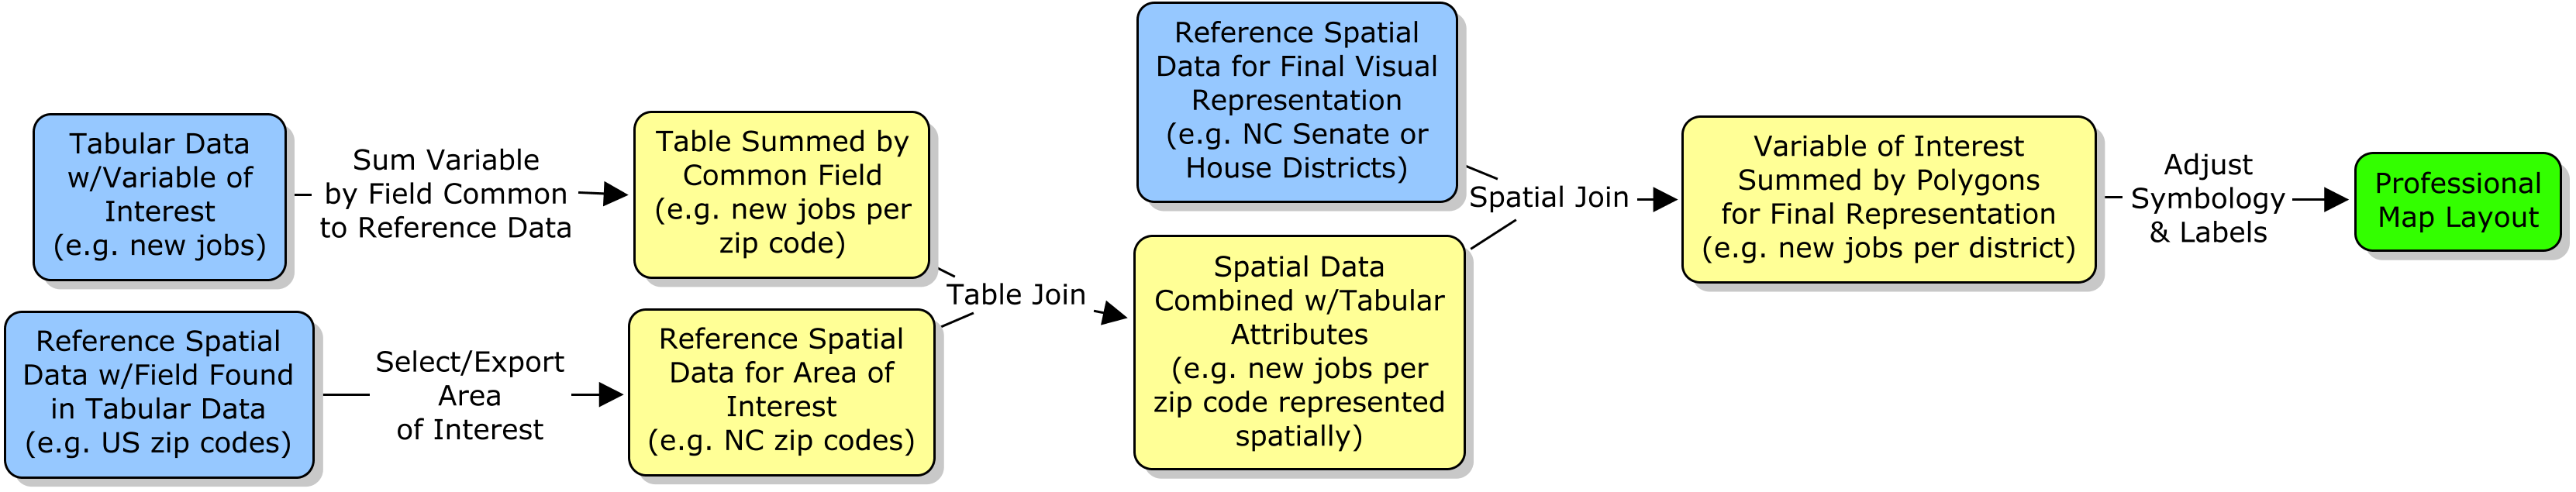
Figure 1. General workflow diagram for joining tables and performing spatial joins to reach the desired map output. Blue boxes represent the input data, while yellow are intermediate steps, and green is the final output. Click on diagram for enlarged image.
Results:
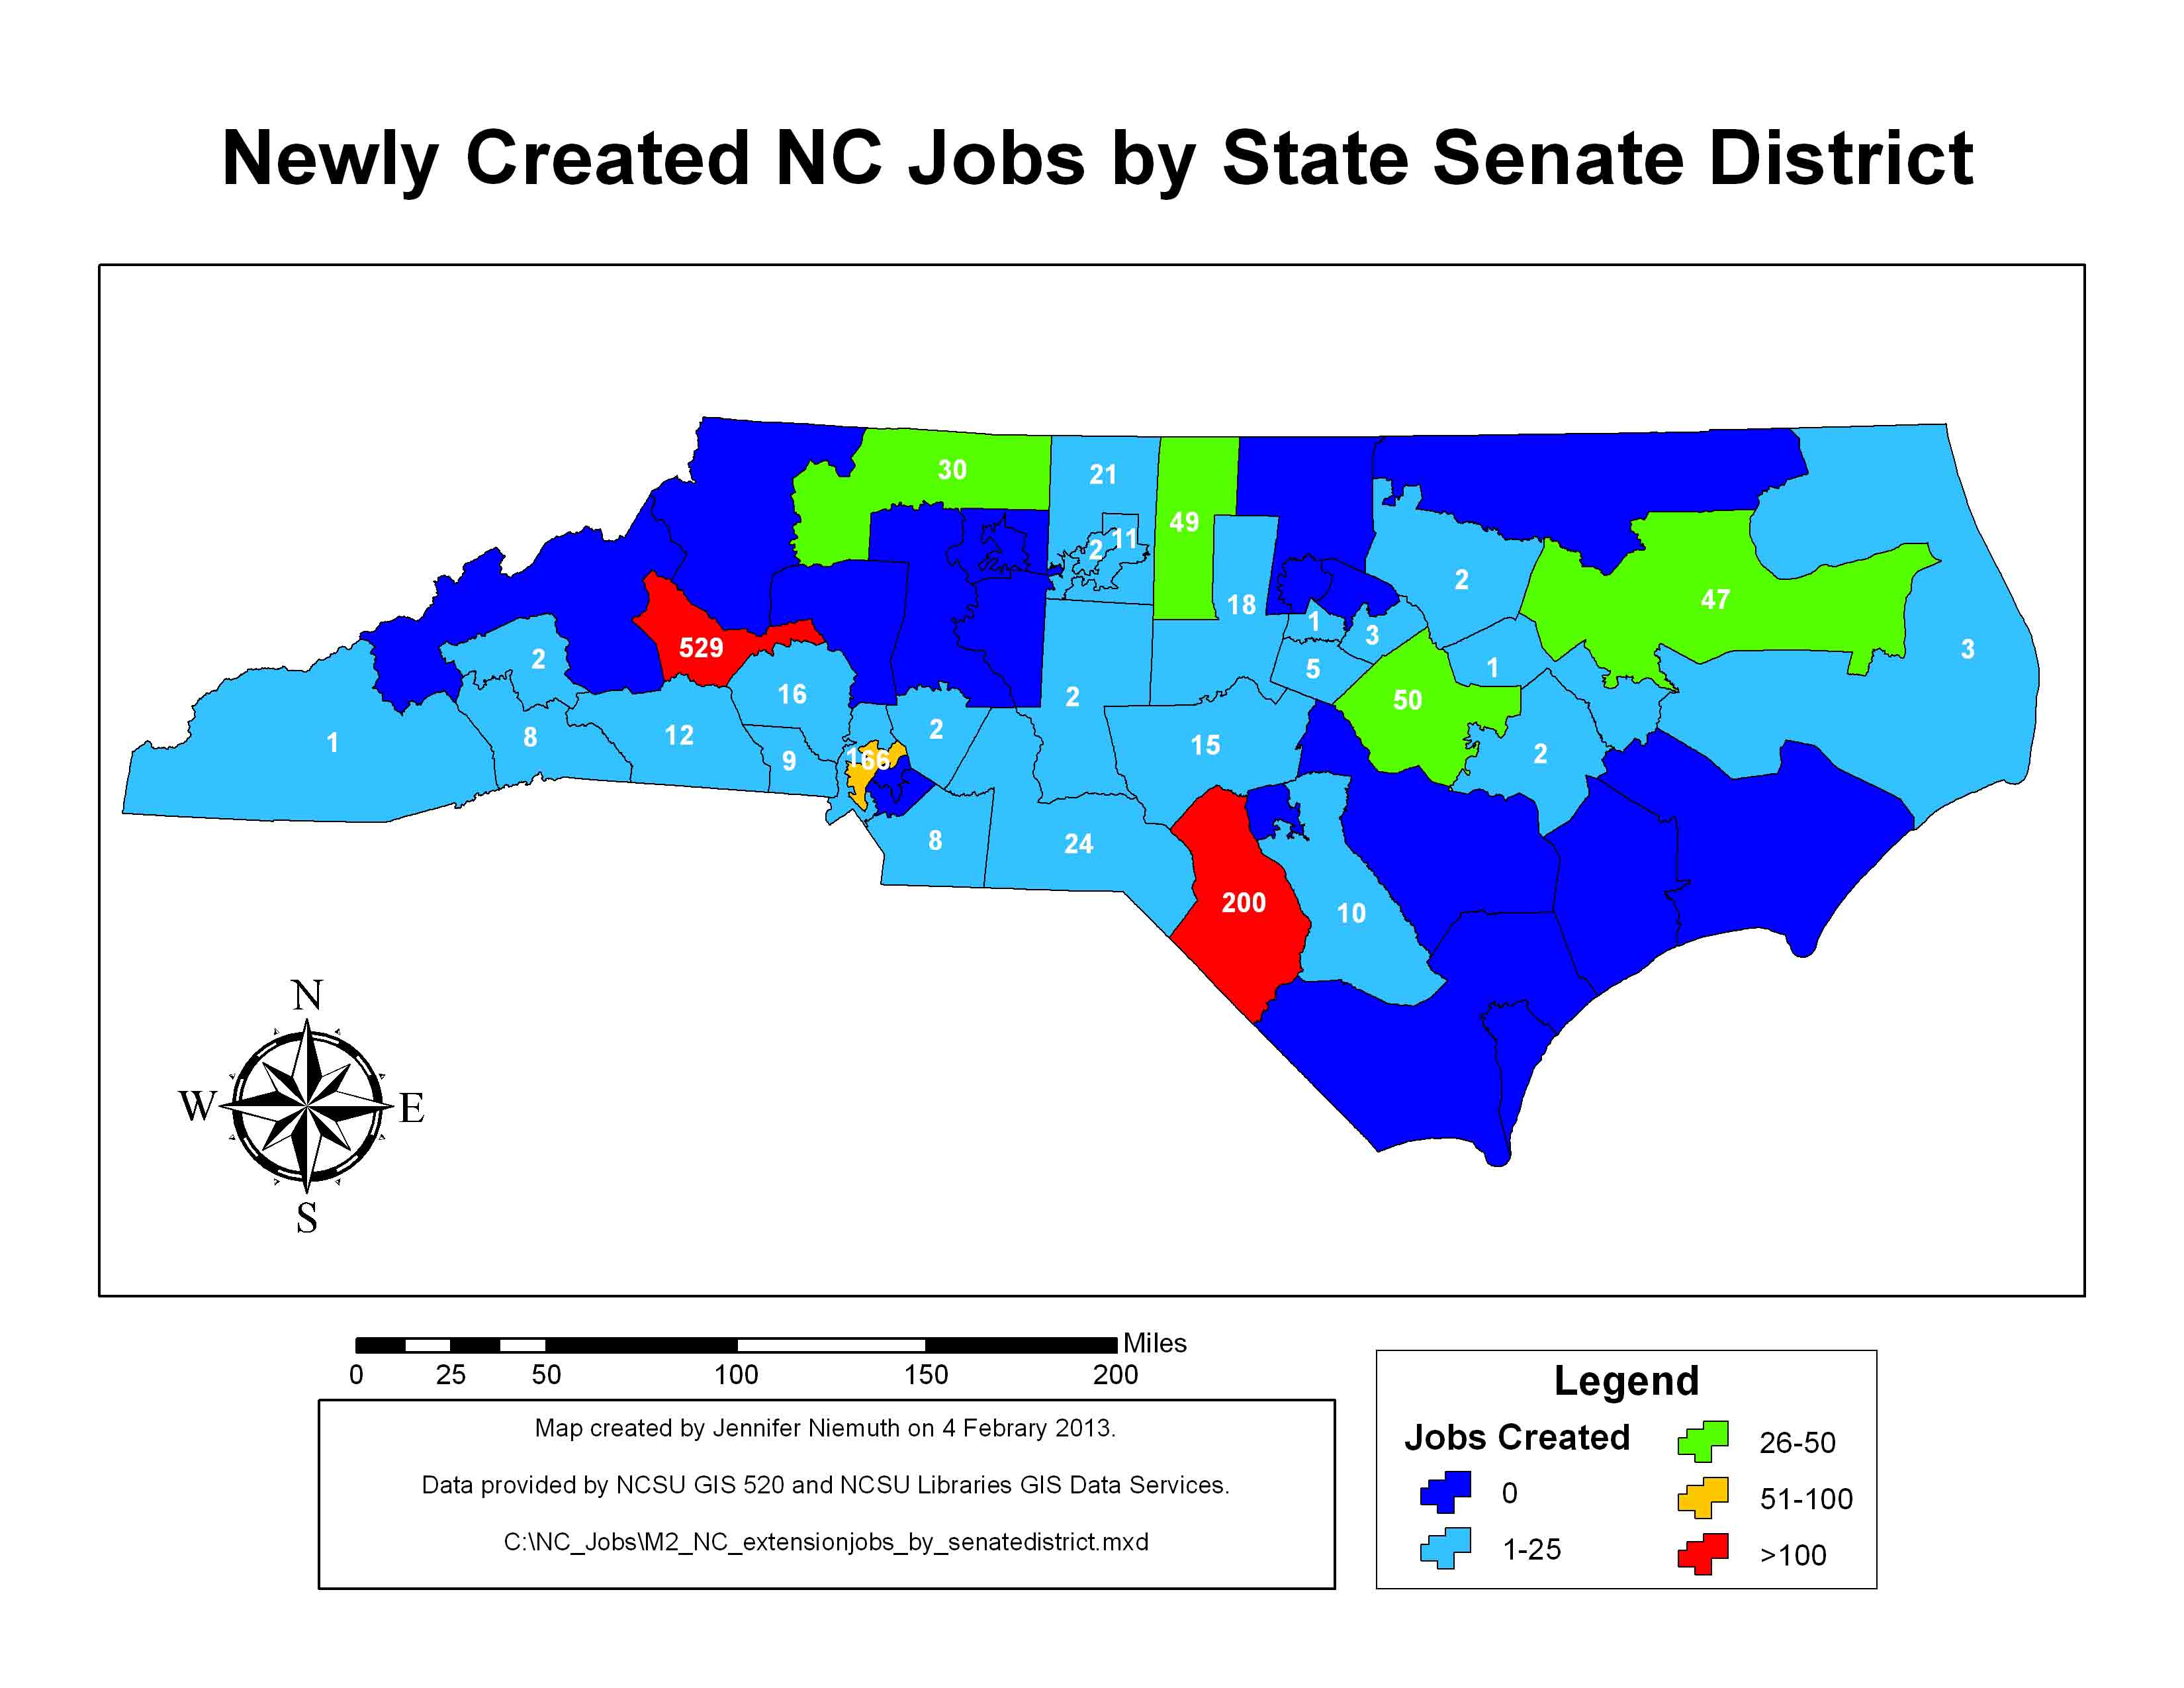
Figure 2. Newly created NC industrial extension jobs by state senate district. Click on map for enlarged image.
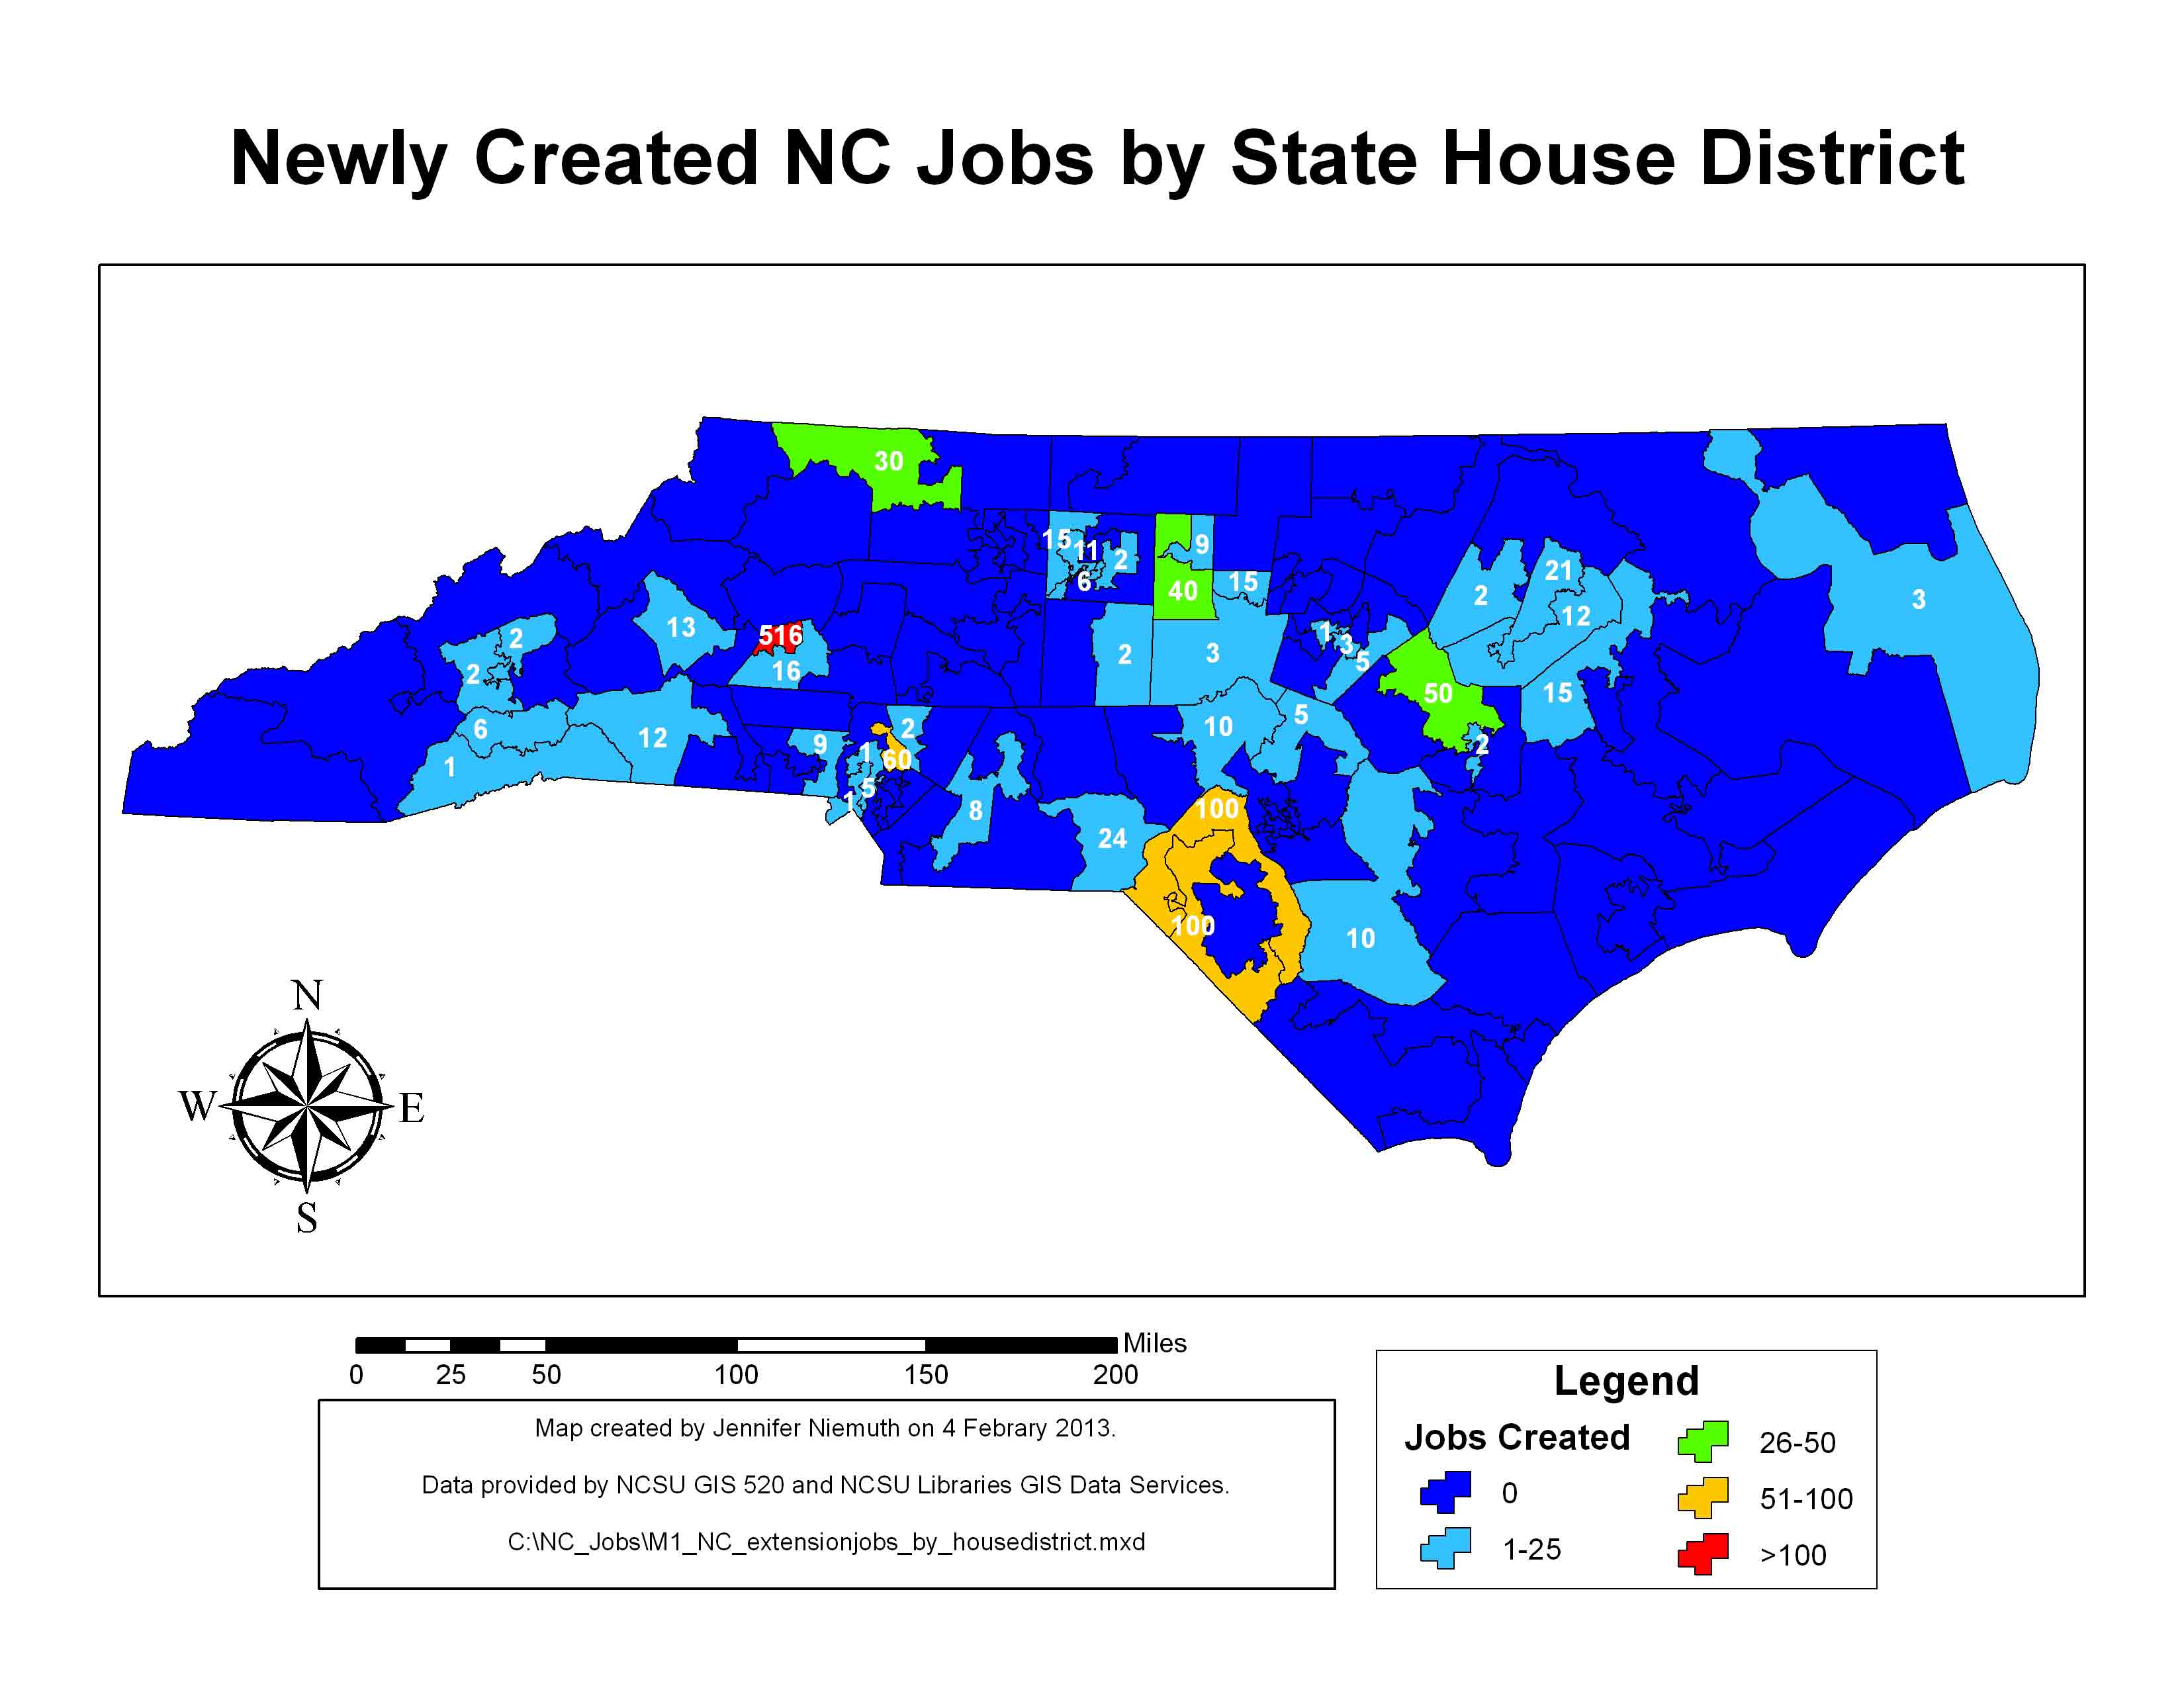
Figure 3. Newly created NC industrial extension jobs by state house district. Click on map for enlarged image.
Application and Reflection: The skills and concepts demonstrated in this exercise are likely to be useful for answering any research question that has a spatial component. Data collected for a survey or study is commonly kept as a spreadsheet or database and will often have a field that could be spatially represented (e.g. county, area code, zip code, etc.). If a reference file with the same field exists, it can be joined to the research data giving the research data a spatial context and saving time versus creating the spatial context by hand in ArcMap.
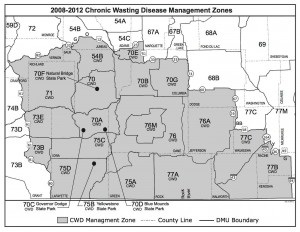
Figure 4. Wisconsin CWD Management Zones (WI DNR 2013).
Monitoring chronic wasting disease (CWD) in white-tailed deer (Odocoileus virginianus) has become a priority for natural resources departments in many states. Management zones are sometimes created where hunting regulations differ from the rest of a state in an attempt to control the disease (Fig. 4).
Wildlife veterinarians and managers want to know where positive animals are coming from. Tabular data collected from hunters at deer registration stations and CWD testing results can be joined to a spatial reference file of the management zones to show which zones are producing more CWD positive deer and possibly where further management should be directed (Fig. 5).
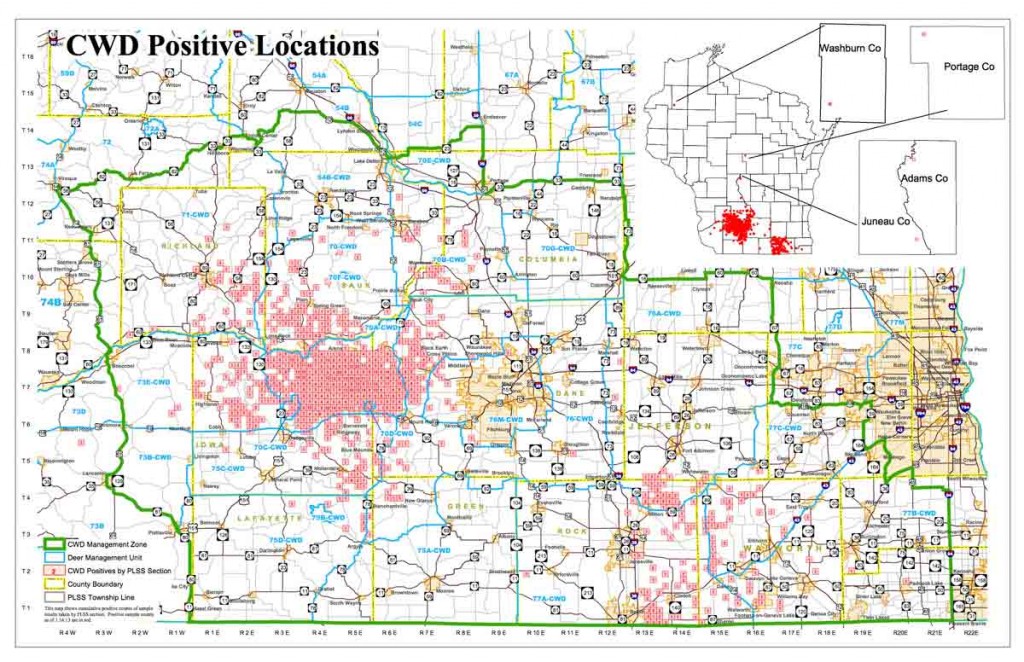
Figure 5. CWD positive deer locations in WI CWD Management Zones (WI DNR 2013).