
Basics of Raster Data (for ArcGIS 10)
Problem: Convert vector data into raster data.
Analysis Procedures: Vector data models represent geography as discrete spatial features. Raster data models represent geography as a continuum, but can also be used as discrete thematic rasters (e.g. temperature or elevation vs. land-use or soil type). These data models often complement each other, but can be converted if necessary (Figs. 1 and 2). Rasters can also be digital or scanned documents that are used as attributes of a feature (Fig. 3).
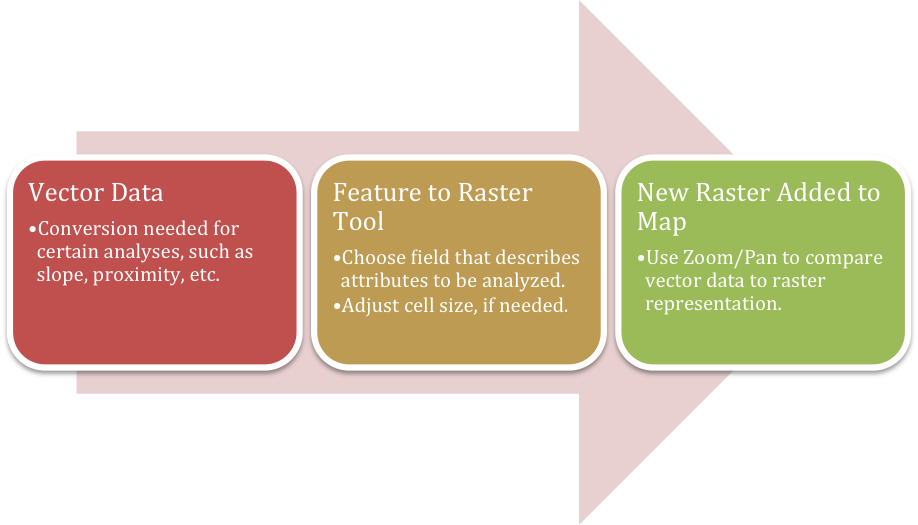
Figure 1. General workflow diagram for converting vector data to raster format in ArcMap.
Raster data is composed of cells in a grid structure. Spatial resolution refers to the cell size and determines the level of detail in the raster. The required spatial resolution is dependent on the type and scale of analysis being performed, accuracy/precision required, and any time/data size limitations.
Scale refers to the displayed level of detail. Smaller scale means less detail. For example, a display scale of 1:5000 has less detail than a display scale of 1:1000 (i.e. 1 unit of measure on the map equals 5,000 or 1,000 of the same unit in reality). If the display scale of two images is the same, but the cell size differs, the image with the smaller cell size will show a greater amount of detail.
A raster dataset may be composed of one or more bands. For example, a digital elevation model has 1 band, whereas a color aerial photo will have 3 bands (i.e. 1 for each color). Raster data can be found in many formats, such as TIFF, GRID, JPEG, MrSID, or IMG formats. TIFF is the most widely supported, can be used for a variety of data types, and works with color, black-and-white, and grayscale images.
Results:
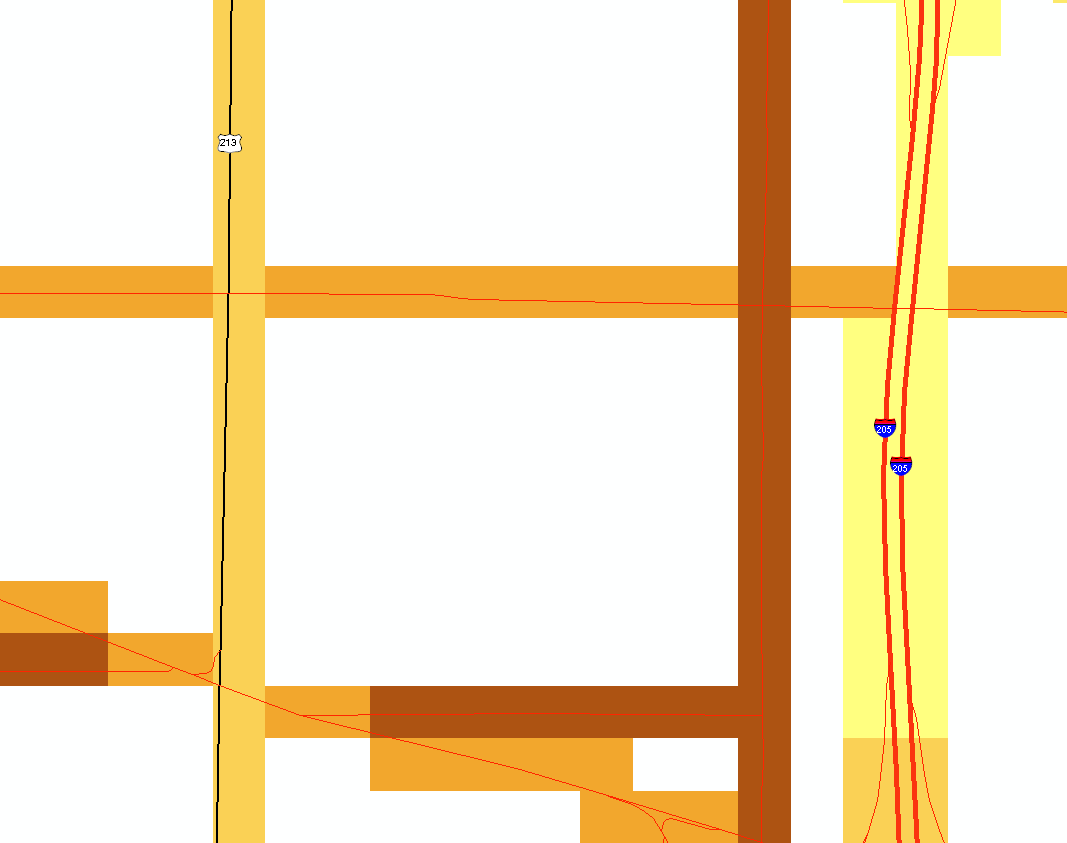
Figure 2. Zoomed in area of a map showing road vector data (red and black lines) that has been converted to raster data (yellow/orange/brown cells). Some data may be lost during data conversion and converted data may be less accurate than the original data. In this example, some of the detail of the roads vector data is lost upon conversion to raster data.
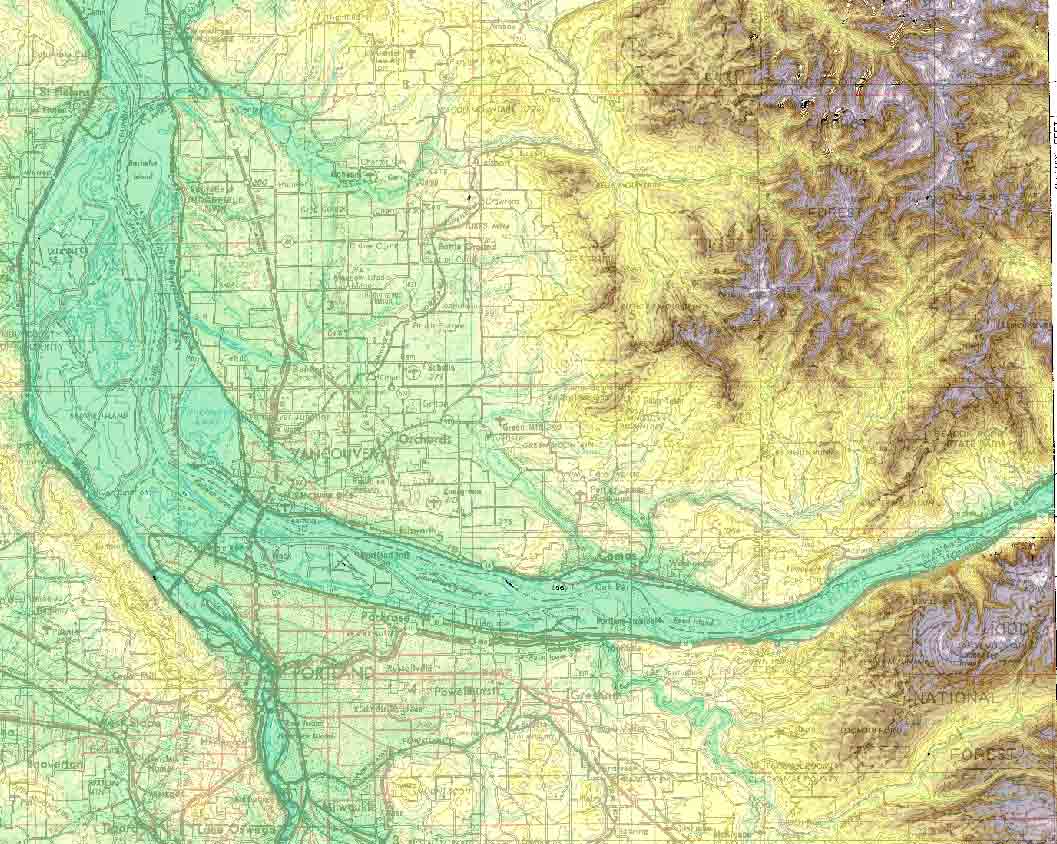
Figure 3. Example showing two raster images overlaying each other to display information about an area in Oregon. The base file is a digital raster graphic (DRG) that is a scanned image from a USGS topographic map. A Shuttle Radar Topography Mission (SRTM)-derived digital elevation model (DEM) has been made transparent and overlaid on the DRG. While the DRG has relevant symbology, the SRTM-derived DEM captures the variability in the actual surface.
Application and Reflection: Raster data allows for the display of continuous data and makes advanced spatial analyses possible. Raster data has many applications within wildlife management, such as modeling climate, planning surveys, and determining habitat suitability, which will be examined in more detail in the following module.

Using Raster Data for Site Selection (for ArcGIS 10)
Problem: Use raster data and fuzzy logic to perform suitability analysis for site selection.
Analysis Procedures: Using GIS analysis to determine the best place for a purpose is referred to as site selection or suitability analysis. This can be done with both vector and raster data. The benefit of using raster data is the ability to do weighted or fuzzy logic analysis in addition to the binary analysis that is possible with vector data. Binary site selection results in a yes/no answer for site suitability. Weighted site selection allows the user to assign relative importance to each layer resulting in a range of least to most suitable sites and should not be used when what you are siting cannot control is location (e.g. wildlife, plants, etc.). Fuzzy logic assigns membership values (out of 1) that indicate the possibility that a site will be suitable.
Prior to performing weighted site selection, all of the raster data must be reclassified in order for suitability to be measured on the same scale (e.g. 1-5, 1-9, etc.). After each layer has been reclassified, a weight (i.e. percentage) must be assigned to each layer to reflect each layer’s importance.
Fuzzy logic can be used for site selection when data does not have discrete boundaries. This method is ideal for analysis of animal/plant habitat (Figs. 4 and 5) or geologic data like where mineral deposits are likely to be located. Fuzzy logic is ideal when prediction is imprecise because it allows the model to include inaccuracy in the data.
Prior to using fuzzy logic for site selection, the raster data must be reclassified based on a selected fuzzy membership type/class that best fits the data. The surfaces can then be overlaid by selecting an appropriate overlay type that combines two or more of the membership data.
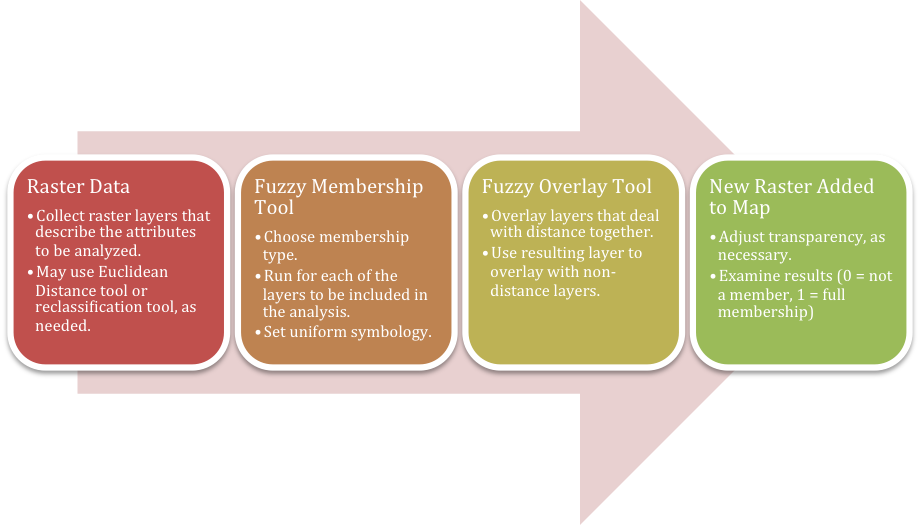
Figure 4. General workflow diagram for using fuzzy logic for site selection in ArcMap. Click on diagram for enlarged image.
Results:
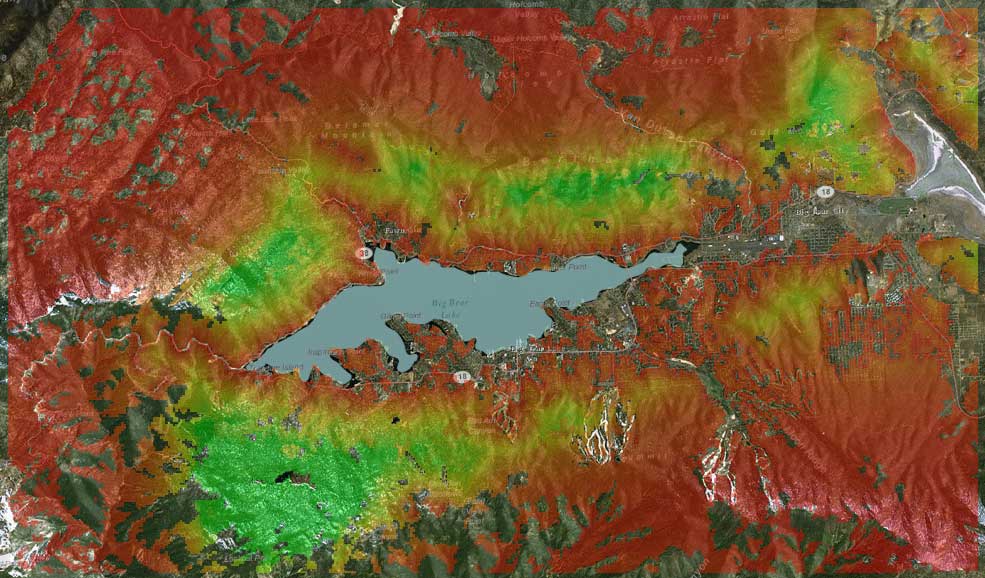
Figure 5. This image depicts the results of using fuzzy logic for site selection when determining possible bald eagle (Haliaeetus leucocephalus) nesting habitat near Big Bear Lake, CA. Red indicates areas where bald eagle nesting is not likely, green indicates nesting is highly likely, and yellow indicates an intermediate possibility for nesting. Three membership layers were overlaid to achieve this result: distance to water, distance to human disturbances, and percent tree cover. The distance to water layer was created using a “small” type fuzzy membership. This type is used when small values have high membership, i.e. eagles are more likely near water. The human disturbance layer was created using a “linear” type fuzzy membership. This makes membership increase as the distance from human disturbance increases. Lastly, the tree cover layer was created using a “near” type fuzzy membership. This type is used when memberships valued at 1 occur at the midpoint of the data, i.e. eagles do not prefer extremely dense or extremely sparse tree cover. Click map to view larger image.
Application and Reflection: Site selection using raster data is a powerful tool in wildlife conservation and management. The type of analysis can be used to determine areas that may be valuable to survey, areas that may benefit from protection, and/or identify areas that could be improved with various management strategies.