Problem: Use various spatial statistical methods to determine if false fire alarms for Battalion 2 of the Fort Worth Fire Department exhibit clustering and assess the level of clustering.
Analysis Procedures: After visually exploring one’s data, spatial statistics can be used to identify and quantify spatial patterns and relationships, such as clustering, within the data. While spatial statistical methods account for spatial characteristics, they also make use of hypothesis testing similar to traditional inferential statistical methods.
The four tools evaluated whether the location of point features can be explained by a random chance (Fig. 1).
- The average nearest neighbor tool calculates an index based on how close features are located and compares that distance to an index for randomly distributed features. This assesses clustering by location only. The tool is used by inputting the feature class of interest and setting the area to a size similar to the dataset. A nearest neighbor ratio, Z-score, and p-value are output.
- The Getis-Ord General G tool examines clustering by value. The tool determines whether areas of similar values are more clustered than would be expected in a random distribution. To use this tool, the dataset must first be examined for the approximate number of neighbors and the distance band. This helps determine the distance range to use.The feature class and field of interest are input and the tool results in a G index, Z-score, and p-value.
- The multi-distance clustering tool (Ripley’s K function) is similar to the nearest neighbor calculation, but can also examine multiple distances and factors other than the next nearest feature. This tool requires the layer of interest, number of distance bands, and also the number of confidence envelopes that should be used. The confidence envelope is a permutation of the random distribution used for comparison. The results are displayed graphically as a comparison between observed and expected results.
- Lastly, the spatial autocorrelation tool (global Moran’s I) combines evaluation of clustering by location and value. This tool requires a layer and field of interest, but also requires that a grid cell size be chosen. The grid cells should be large enough that all have at least one data point, but small enough to result in a range of values. The tool results in a Z-score and a p-value. A procedure log for this exercise is available here.
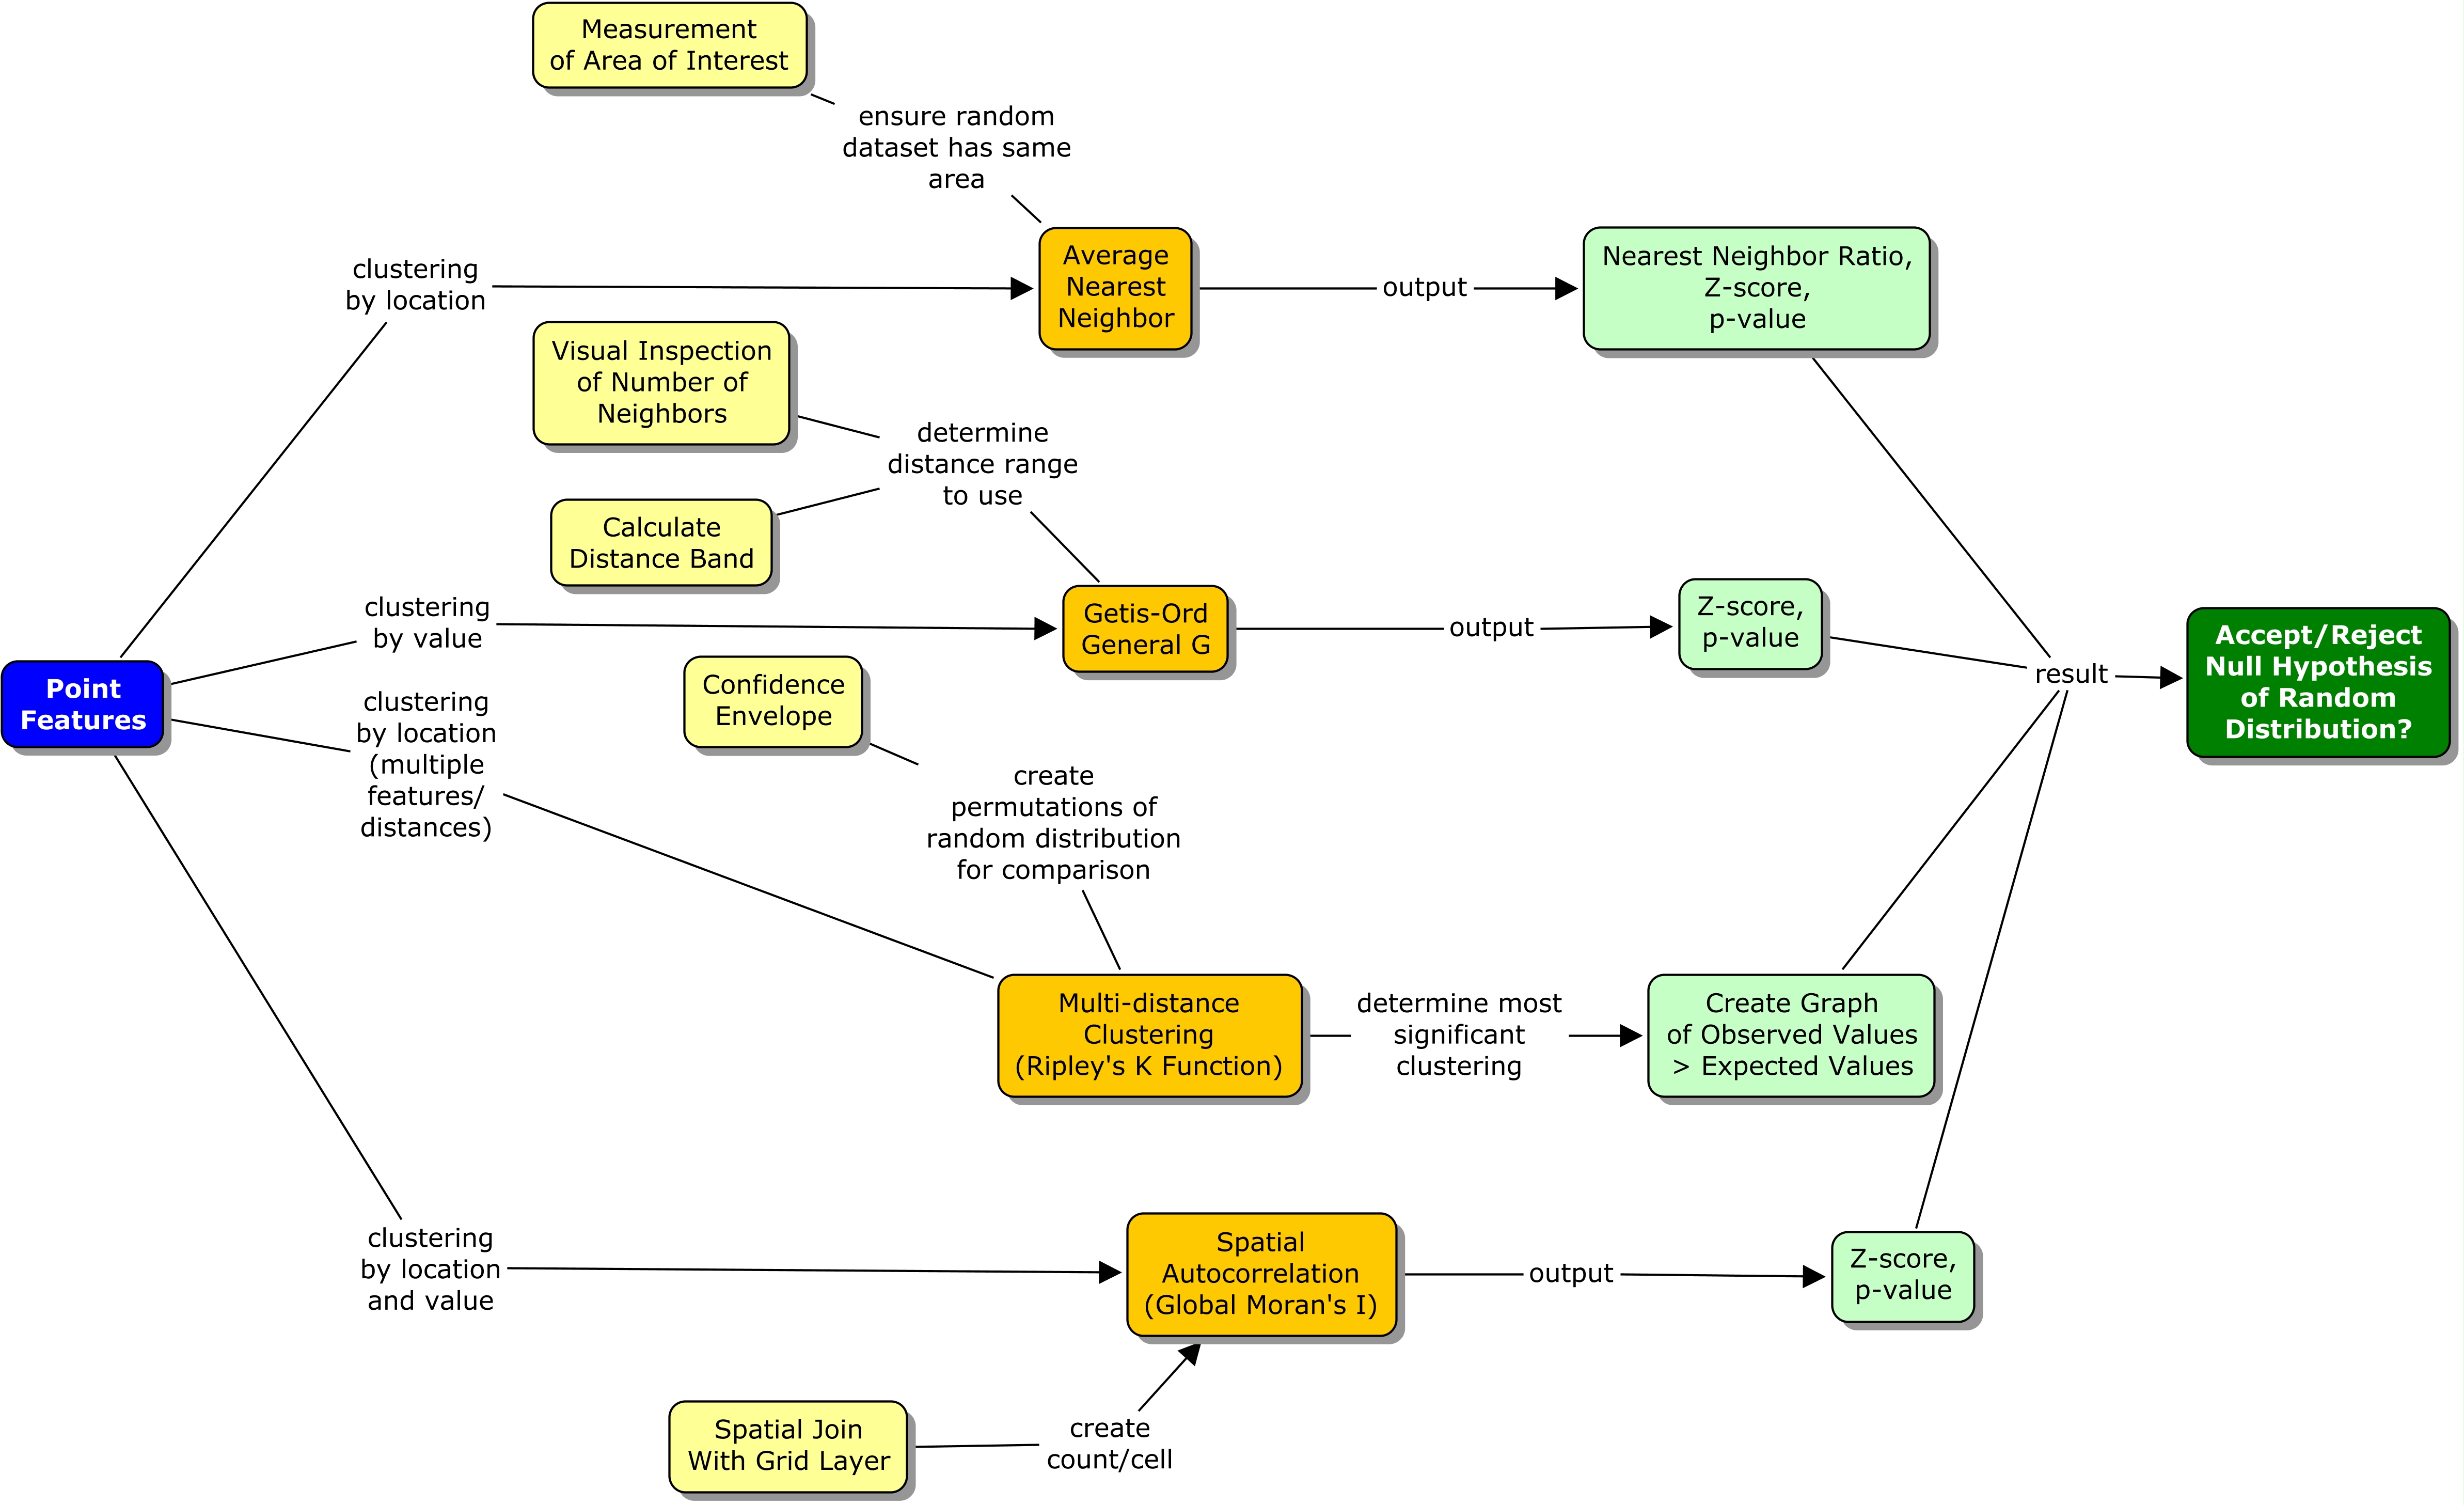
Figure 1. Spatial statistics workflow diagram for evaluation of clustering. Click on diagram for enlarged image.
Results:
[cycloneslider id=”spatial-statistics”]
Application and Reflection: The skills and concepts used in this exercise can be applied to many applications in wildlife ecology and conservation. Wildlife management practices, such as the placement of fences to prevent wildlife-vehicle collisions, could be evaluated through the use of spatial statistics and assessment of clustering. Clustering of mortalities may indicate areas in disrepair or fence ends that require additional management. Spatial statistical methods are also commonly used in landscape ecology to evaluate responses to climate, migration, dispersal, competition, predation, patchiness, etc.
Nearest neighbor distances and multi-distance spatial clustering (Ripley’s K Function) has been used to attempt to determine the effects of conservation management actions (i.e. mowing) on nest locations of burrowing owls (Athene cunicularia) (Fisher et al. 2007). Ripley’s K Function effectively assessed the clustering of owl nests, the scale and timing of nest clustering matched the conservation management action, but in this case a causal link could not be determined.